Subscribe to GEN
Login to GEN

Oversight is infrastructure monitoring built and run by GEN. It watches servers, clusters, storage, networks and services from as many places as you choose, and raises the alarm only once the evidence agrees. When something has genuinely broken, one message arrives that names the cause, shows everything it has taken down with it, and says in plain English how urgent it is.
We wrote it because the products we had used for years kept failing in the same ways: one flaky link calling an outage, alert storms that buried the cause, green dashboards sitting over probes that had quietly died, a mistyped threshold waking an engineer at three in the morning, and a licence that grew every time the estate did.
It is also what we use ourselves. The Proxmox clusters, Ceph storage, mail platforms and network equipment carrying our customers' services are watched by Oversight, so everything described here has been proven on infrastructure we are directly answerable for.
In a traditional monitor, a host belongs to one poller, proxy or probe. That single vantage point decides whether it is down, so when it has a bad day, so do you. Oversight turns the model round. A check joins probe groups in different places, each group forms its own view, and the state is settled by how many of those views agree.
| Failing views | Default state | What it means |
| Exactly one | OK | One vantage point struggling is the internet, not an outage |
| More than one, not all | Warning | Something real is happening |
| Every reporting group | Critical | Nobody can reach it |
What counts as critical is a property of the equipment, not of the monitoring system, so Oversight lets you say it at every level. Each level is settled the same way: worst first, and by how many of the things beneath it agree.
As many conditions as it needs, worst first: lists, ranges, patterns and changes. 1, 2 or 3 is a warning, 5 is critical.
Every group forms its own view from those conditions, with a count of failed reads before it will call anything down.
The views vote, and ANY, SOME and ALL each map to whichever state suits the thing being watched.
Its checks roll up under the same three buckets. A server goes red on any failed check.
The same rule once more. A resilient switch fabric shrugs off one lost path, and twenty web servers matter only when several fail.
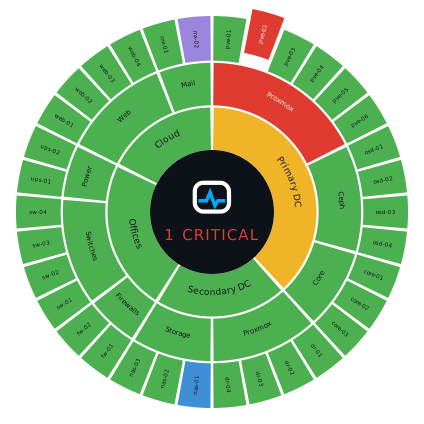
When a check fails, its device, group and site can all follow it down. Most monitoring answers with four alerts, or with "Sensor X is down, and 45 others". Oversight folds the whole incident into one message per rule, drawn as a tree: the site, the group, the device that went critical and the check beneath it that took it there.
Primary DC                        WARN
└ Proxmox                         CRIT  2 devices
  ├ pve-02                        CRIT  4m
  │ ├ Cluster quorum    offline 1  CRIT
  │ └ Guests  133 proxy stopped    CRIT
  └ pve-04                        WARN  1m
    └ Ceph health     HEALTH_WARN  WARN
Offices                             OK
└ fw-01  Ping                        cleared

An experienced engineer can read a week of figures and see trouble coming. Most of the people who receive an alert, or who pay for the monitoring, cannot. Oversight's AI reads the evidence for them and says what has happened, what it probably means and how urgent it is. Nothing is lost by it, because the usual detail follows underneath.
The broadband line BT-001 at Head Office has
stopped responding to ping, so the site has most
likely lost its internet connection. This failure
has persisted for four minutes and needs attention
now.

Head Office: CRIT
  Broadband: CRIT
    BT-001: CRIT
      Ping: CRIT (no reply)
The same writing up goes into scheduled reports. Daily, weekly or monthly on local time, a report reads the series you choose, sets the period against the one before it, and explains what the data shows: the typical level, the pattern, the peaks, the trend and whether anything needs doing. Average, median, 95th percentile and the busiest hours are worked out exactly first, so the AI interprets the arithmetic and is never asked to do it.
Oversight reads what your platforms say about themselves rather than asking whether a port answers. One fetch fans out into as many separate alarms as the answer deserves, so five checks reading five fields of one document cost a single request, and SNMP checks against one target share a GETBULK.
Quorum, the nodes you expect, and the online and offline ones by name. A node missing from the list altogether still counts as offline.
Every VM and container as its own value with its own rule. Backup, migration and snapshot read as the expected states they are, and a vanished guest reads as not found.
Watched alongside the cluster it protects, so a failing backup is an alarm now rather than a surprise at restore time.
Health and the checks raised, monitor quorum, OSDs up and in, placement groups not active and clean, and manager availability.
Per-core CPU, memory, disk buffers, driver state, interfaces, connections, filesystems and full iostat tables. Read only and incapable of acting on the host, so nobody holds SSH keys to your estate.
Choose an object from the vendor's MIB instead of typing an OID. Type, unit, scaling and value names fill themselves in, so tenths of a volt chart as volts and a bare 2 reads as 2 (warning). v1, v2c and v3.
Method, headers, body and TLS under your control, including Redfish, HPE iLO and Dell iDRAC. Extract by JSON path, XPath, regex, header, status or size, then save the working check as a template and fill in the rest of the rack from it.
Every endpoint and trunk, with the names of those down carried into the alert. Name the trunks that must exist and one check watches exactly those.
MySQL and MariaDB queries, MongoDB commands, and FTP or FTPS with login and transfer timed apart. A backup that is present, the right size and eleven days old is a failure, and Oversight says so.
HTTP(S), DNS, SIP, SMTP, IMAP4, RDP including whether NLA is enforced, TCP and ping. Firmware stuck on TLS 1.0 can be watched deliberately, per check, without weakening anything else.
The usual way to prove that mail arrives is to sign in to the mailbox and look. That means leaving IMAP or POP3 switched on, keeping a service account and its password inside the monitoring system and, on hosted mail, registering an application for OAuth2 or carving an exception out of MFA. All of that, and it still proves one direction. Oversight sends a real, signed message in through your MX, and your mailbox forwards it straight back out through your own route. One message proves that mail is reaching you and that it is leaving you.
To       mailtest@example.com
MX       mx1.example.com
TLS      TLSv1.3
Outcome  RETURNED                    OK
Detail   Returned in 3 seconds
To       sales@example.org
MX       mail.example.org
TLS      TLSv1.2
Outcome  LOST                      CRIT
Detail   Accepted but not back within
         10 minutes
Everything Oversight knows is available through one read-only API: state, readings, history, availability and charts for any object in the tree. JSON or CSV, in flat rows that Grafana's Infinity datasource reads without transformation, so a wallboard, a customer portal or an archive can take what it needs and change nothing.
https://oversight.im/api/v1/state
  ?problems=1&latest=1
X-API-Key: ovs_********

{"endpoint": "state",
 "count": 1,
 "rows": [
  {"id": 4812, "type": "SENSOR",
   "name": "Cluster quorum",
   "state": "CRIT",
   "since": "2026-09-17T09:38:12Z",
   "bucket": "ALL",
   "failing": 3, "reporting": 3}
 ]}
Monitoring touches everything, so it must never become the way in. Every probe is run by GEN, reaches outwards rather than listening, and holds nothing on disk that would help anyone who took it.
No per-sensor licence, no tiers and no prepayment. Every read, meaning one result from one probe group for one check, costs a fixed number of credits set by what it involves, and a credit is £0.00002. Invoiced monthly in arrears, so a simple check costs almost nothing and a heavy one costs what it takes. A probe group that is down produces no reads and costs nothing.
| Example | Indicative cost |
| A ping every minute, from one location | £0.86 a month |
| An email round trip every fifteen minutes | £0.35 a month |
| A Proxmox guest check, from three locations every minute | £20.74 a month |
| A website check, from twenty locations every minute | £69.12 a month |
Rules, schedules, templates, escalation, state evaluation and delivery history are included and never charged, as are email, Matrix, Rocket.Chat, webhooks and tickets. SMS and voice are metered separately. Every check shows its cost per read and a monthly estimate as it is configured, and there is an estimator for your own estate on the Oversight site.
The points where Oversight differs most from the products it replaces. Every entry below is taken from that vendor's own published documentation, checked on 16, 17 and 19 September 2026, and the full table with its sources is on the Oversight site.
| Oversight | Zabbix | SolarWinds | PRTG | Nagios | Checkmk | |
|---|---|---|---|---|---|---|
| Checks belong to a group of probes, not one collector | Yes A dead probe's checks move to its peers in about two minutes | Partly A host can join a proxy group, but one proxy watches it at a time | Partly One polling engine per node, with standby pools for failover | Partly A sensor belongs to one probe, unless a failover cluster is built | Not documented | No One site monitors each host |
| The state is decided by how many locations agree | Yes Every probe group votes, and each bucket maps to a state per object | No Proxy groups fail over, they do not vote | No High availability pools are standby, not voting | Partly A failover cluster shows Down (Partial). No quorum setting | Not documented | No One site monitors each host |
| No data is kept apart from downtime, by default | Yes Grey and labelled, with coverage reported beside availability | Not documented An Unknown state exists. Its place in SLA figures is not documented | Not documented An Unknown status exists. Its place in availability is not documented | Not documented A grey Unknown exists. Its place in uptime reports is not documented | Not documented Unknown and stale results exist. Their place in reports is not documented | Partly Configurable, and unmonitored time can be shown separately |
| A corrected rule can be applied to readings already taken | Yes Raw readings are kept exactly and the history is worked out again | Not documented | Not documented | Not documented | Not documented | Not documented Annotations reclassify periods. Re-applying thresholds is not documented |
| The message shows cause and consequence as a tree, worst first | Yes Site, group, device and the check beneath it that took it there | Not documented | Not documented | Not documented | Not documented | Not documented |
| A plain English overview can lead the message | Yes What happened, where, what it probably means and how urgent | Partly Community add-ons on the vendor's blog. Nothing built in | Partly A chat assistant in technical preview, not in the message | Partly Alarm Insights in early access, not in the message | Not documented | Partly Explain with AI, in the interface and in one edition only |
| The AI runs on the provider's own hardware, with no prompt logging | Yes GEN's own models in GEN's own datacentres, and nothing is logged | No The add-ons send your problems to Google's Gemini | No Requests go to the vendor's cloud and on to commercial providers | Not documented Where Alarm Insights runs is not documented | Not documented | Not documented It runs in the vendor's cloud. The model is not documented |
| One test proves mail both reaches you and leaves you | Yes In through your MX, then back out through your own route | Not documented The official template checks the TCP port only | Partly One direction, into a mailbox it signs in to | Partly One direction, into a mailbox it signs in to | Partly One direction, into a mailbox it signs in to | Partly One direction, into a mailbox it signs in to |
| No login to your mail at all | Yes A forwarding rule is the whole of it, and one way needs nothing | Not documented | No Needs mailbox credentials and a named SMTP server | No Needs an IMAP or POP3 login | No Needs SMTP and IMAP details | No Needs a mailbox login |
| What you have to host | Nothing. GEN runs the service end to end | A Linux server, database and proxies, or the vendor's cloud | Windows Server and SQL Server, with polling engines | A Windows core server and probes, or hosted monitoring | A Linux server. No vendor-hosted edition documented | A Linux server, appliance or container, or the vendor's cloud |
Zabbix, SolarWinds, PRTG, Nagios and Checkmk are trademarks of their respective owners, who are not affiliated with GEN and have not endorsed this comparison. Where a vendor documents nothing either way we say so rather than claiming the feature is absent.
Oversight has its own site at oversight.im, where you can take probe groups down one at a time and watch the state follow, work out the cost of your own estate, and read the full comparison against the established monitoring products. It is a managed service, running across four live sites ahead of general release.
A set of Oversight probes in one place. A check belongs to the group rather than to a single machine, so every probe in it reports in every ten seconds, and a probe that dies has its work picked up by its peers within about two minutes. A check can join probe groups in several different places, and each group forms its own view of it.
By how many probe groups agree. By default, exactly one failing view is OK, because one vantage point struggling is the internet rather than an outage; more than one but not all is a warning; and every reporting group failing is critical. A probe group that did not report is left out of the count, never counted as reaching, and each bucket can be mapped to whichever state suits the object being watched.
Per read. A read is one result from one probe group for one check, and it costs a fixed number of credits set by what it involves. A credit is £0.00002, so a ping every minute from one location costs £0.86 a month and an email round trip every fifteen minutes £0.35 a month. There is no per-sensor licence, no tiers and no prepayment, it is invoiced monthly in arrears, and a probe group that is down produces no reads and costs nothing. SMS and voice are metered separately.
No. Oversight sends a real, signed message in through your MX, and your mailbox forwards it straight back out through your own route, so one message proves that mail is reaching you and that it is leaving you. A forwarding rule is all it takes, ideally on a mailbox kept for the purpose, and the test runs from GEN with no probe involved. Where forwarding is not possible, the one-way test asks for a delivery receipt and watches for the receipt or the bounce.
No. Every probe is run by GEN and connects outwards over HTTPS only. Nothing connects to a probe, no inbound port is opened on your network, and a probe accepts no instruction it did not ask for. Each probe signs every request with its own ed25519 key, GEN holds only the public half, and credentials are held in memory, never written to a probe's disk.
It is a managed service, run end to end by GEN, so there is nothing for you to host. Its AI models run in GEN's own datacentres, with no third-party AI service, no public cloud and no prompt logged. Oversight also watches the Proxmox clusters, Ceph storage, mail platforms and network equipment carrying GEN's own customers' services, and it is running across four live sites ahead of general release.